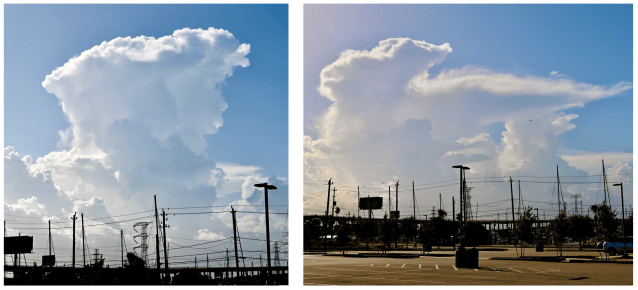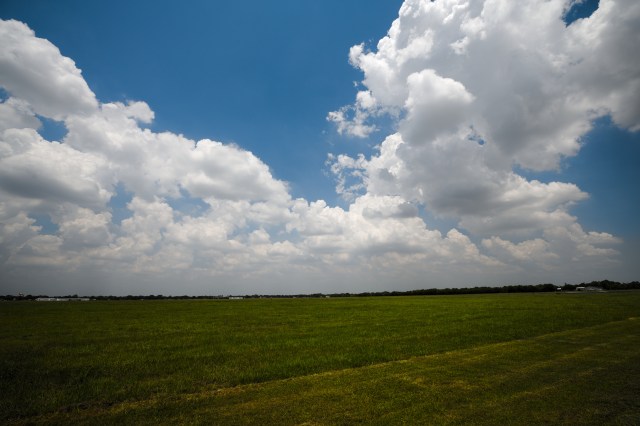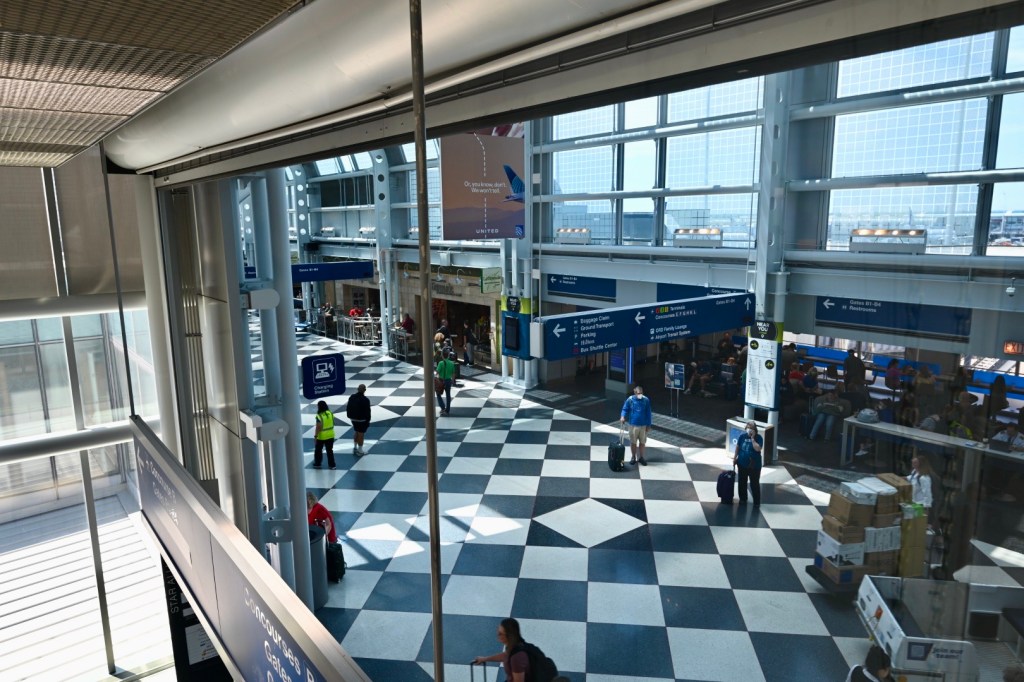
Today is a down day. A day to catch up on some tasks back in Chicago, a day to do some planning and a day long planned to pay a visit to our friends at the National Weather Service. The winds blowing moisture in from the Gulf of Mexico slackened overnight which meant for the first time in a few days now early morning rain clouds.
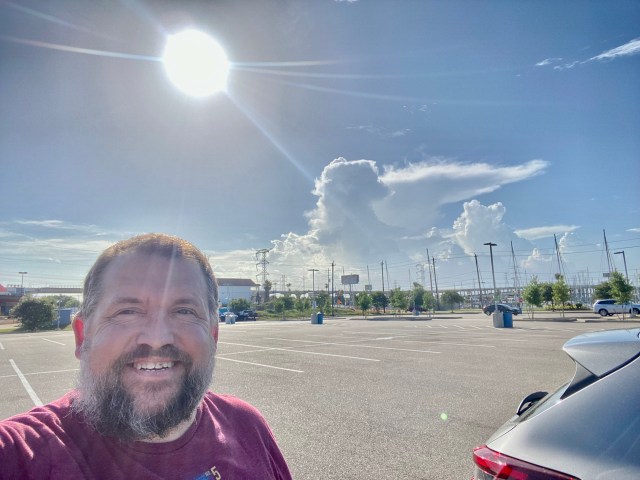
In fact it dawned clear! I headed down to the nearest coastline on Galveston Bay and just missed some Dolphins, but I could see a lot of scared fish still jumping out of the surface. Really happy with my choice of Kemah as a place to stay as it is so walkable.

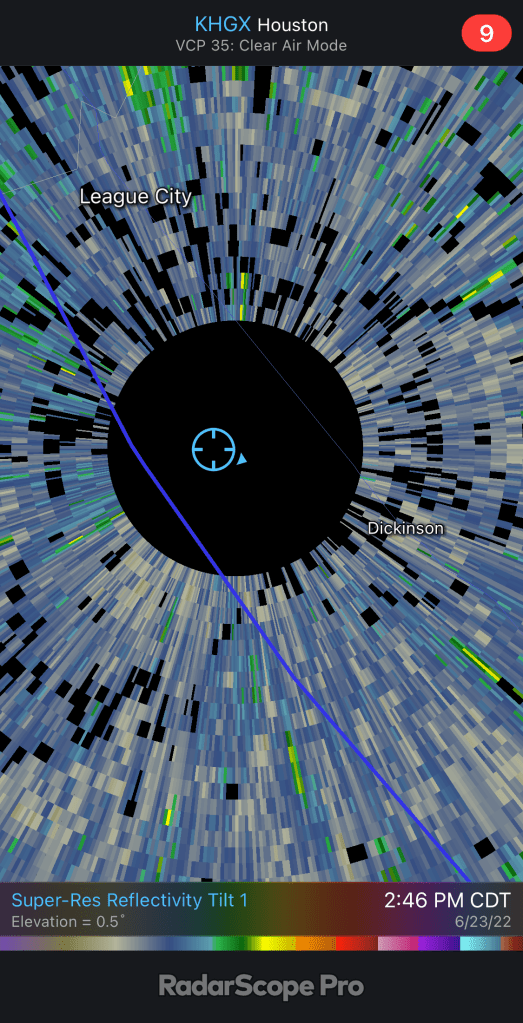
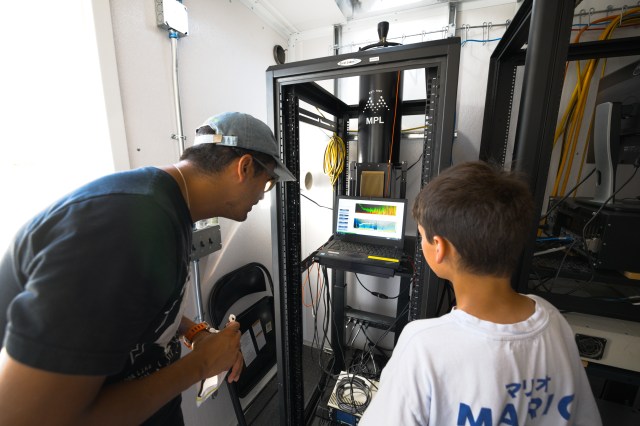
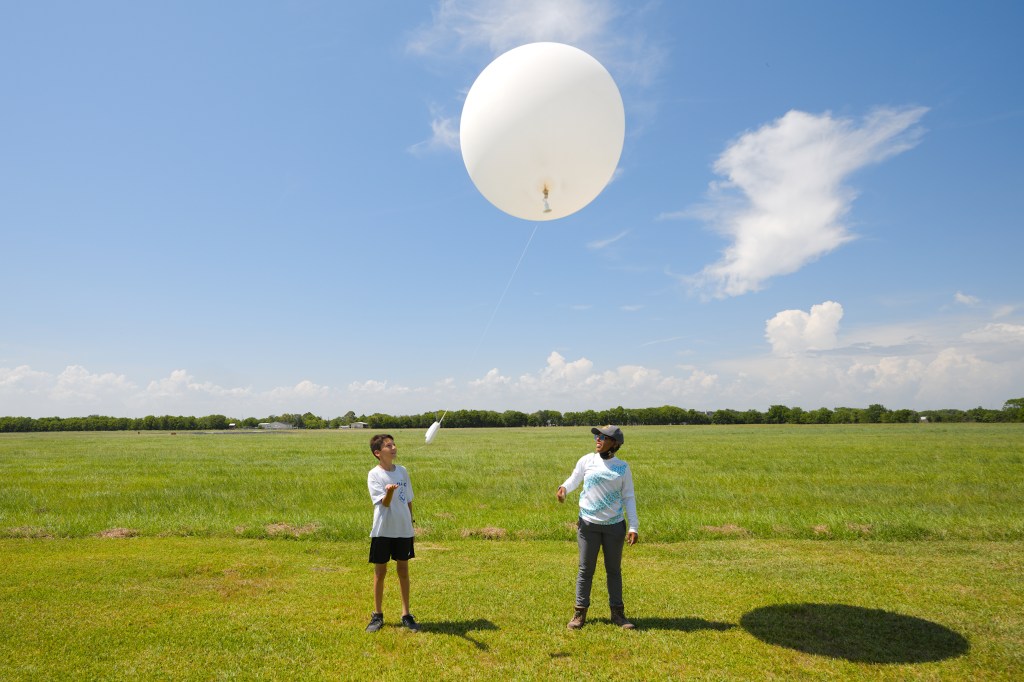
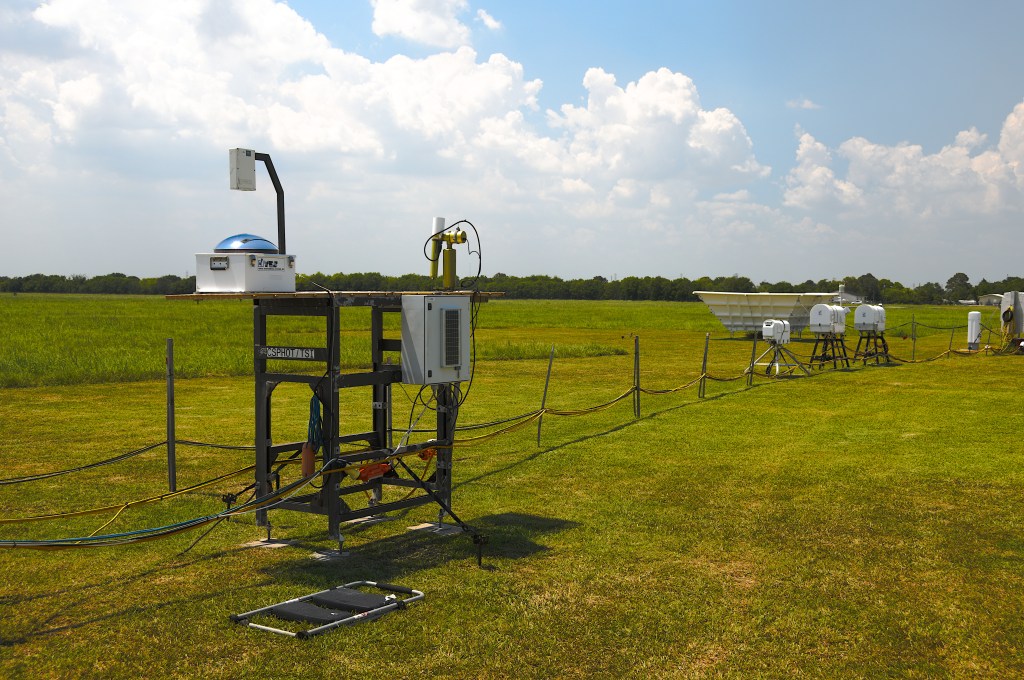
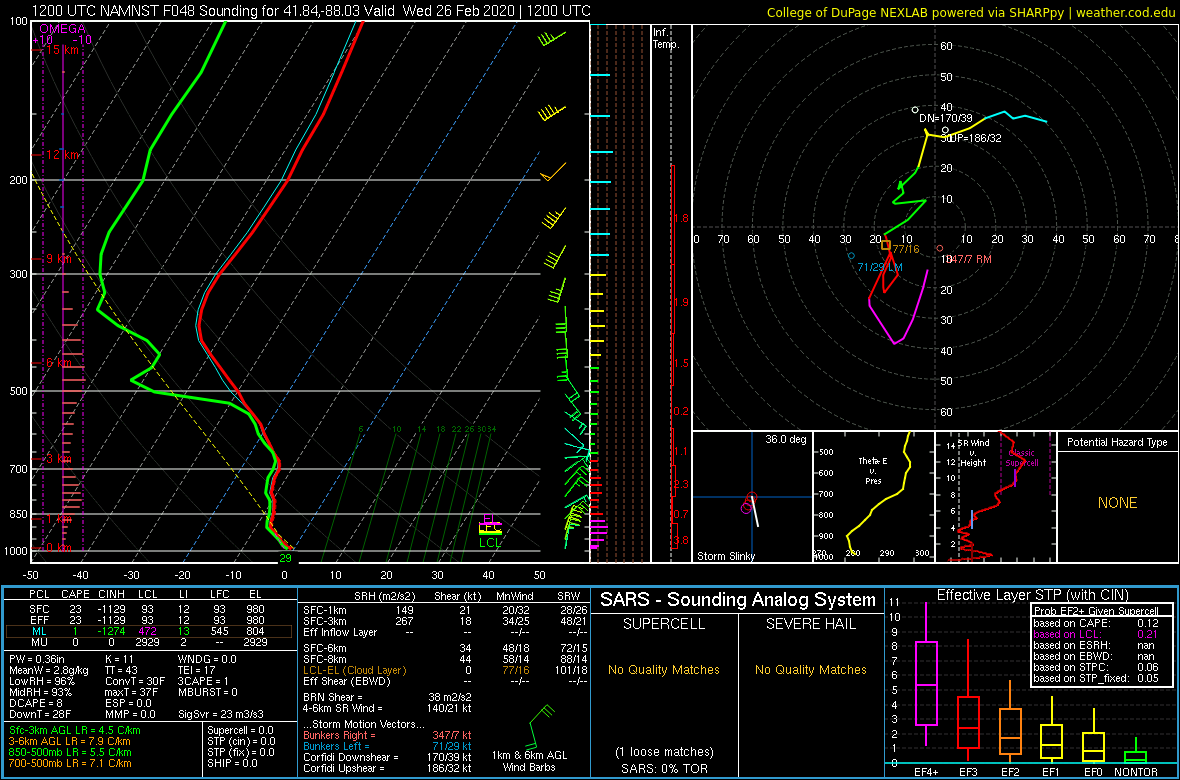
As you may have seen from my posts we have an active forecasting activity during what is called the “Intensive Operational Period” or IOP of TRACER. We forecast for a variety of reasons; It helps us target out limited (1 in 4 days during the IOP from June 1st to September 30th) days we can call for enhanced operations for soundings (weather stations attached to balloons) so it is essential to forecast the most scientifically interesting days to do so! Right now pickings are a bit slim. Which is why nailing the right days to go “up” is essential. Second, it creates a record of “what happened”. By becoming “operationally aware” and recording our forecast briefings we create a impression of the sequence of events which will aide in future analysis.

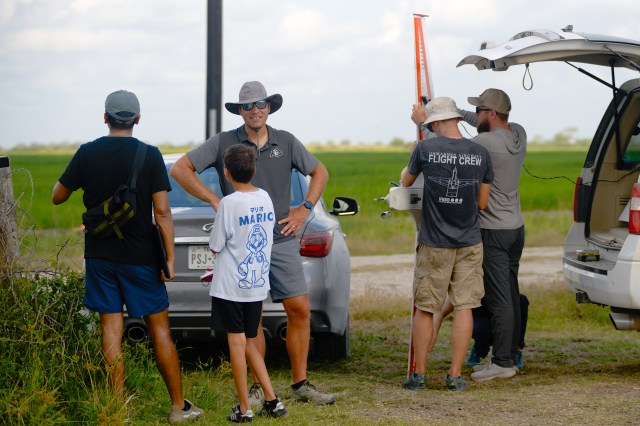
Finally; it is FUN! While this sounds flippant, fun matters. Having fun is important. Being fun brings in young scientists and engages the old hands in mentoring them. I was young once. Heck even Mike Jensen was young once and now he lead a massive field project. I am SURE a future leader is one of our forecasters or assistants on this project today.
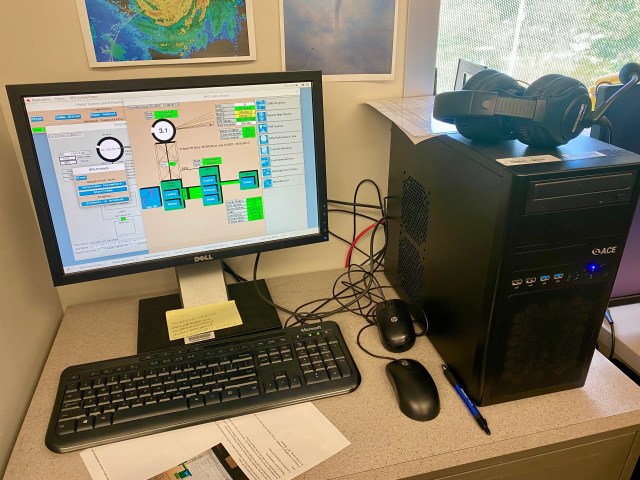
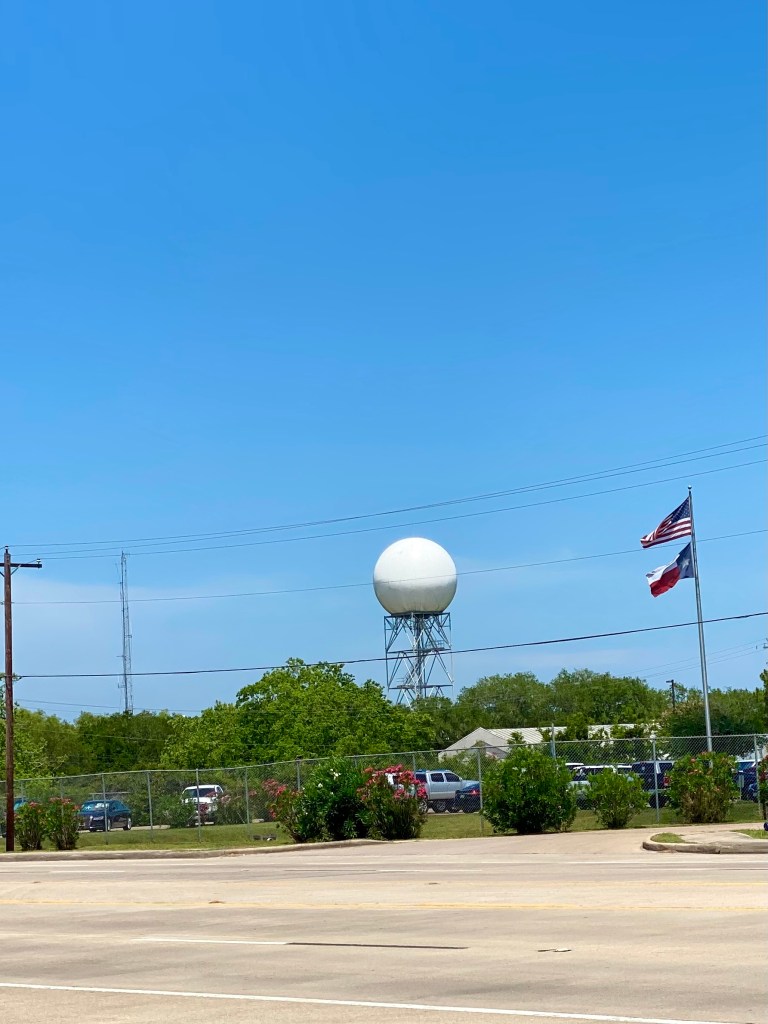
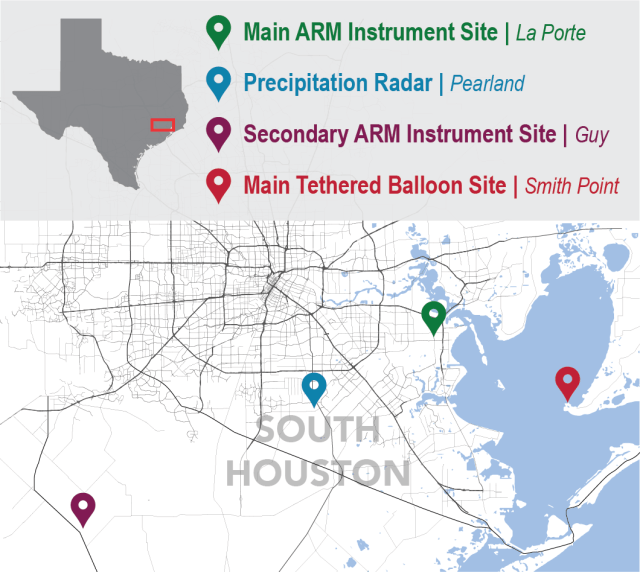
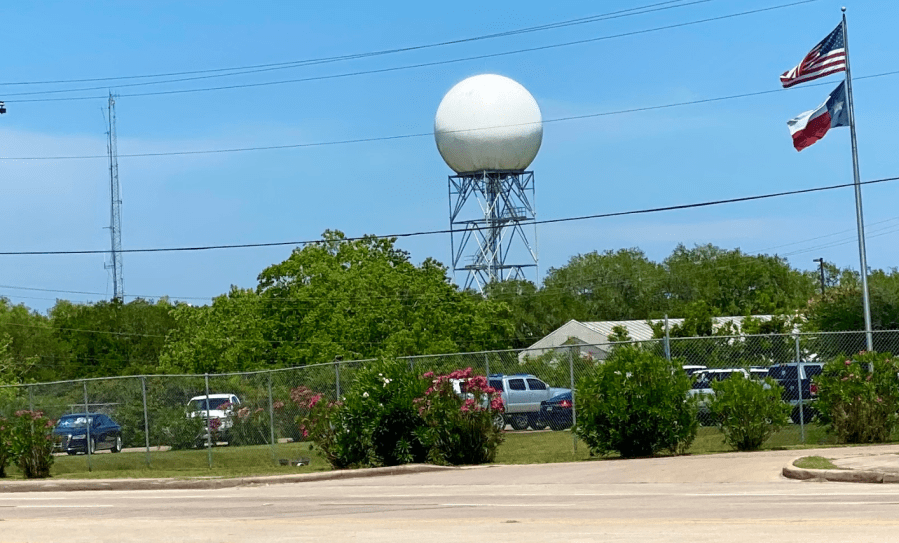
To this end I am so grateful to the fine folks at the National Weather Service at the Houston Galveston office in League City, Texas. Having the team at the NWS office who really know their stuff is so vital. The calls we have each day are forecast discussions. The forecast team (forecast coordinator, three bench forecasters for verification, clouds and convection and air quality) and 1-2 assistants (most important job) come into the call presenting the current picture of the weather. Everyone on the call then discusses this and amends the thoughts of the team.
Having the NWS as the first “sounding board” is amazing as they add the local knowledge to a diverse ground of minds focused on Houston. It was a real pleasure to visit the office today. So happy to have these NOAA professionals involved in enhancing a DOE project aimed at improving our knowledge of those tiny particles and their impacts on big clouds to improve weather predictions. From tornadoes to climate!