
This is basically a dump from our Departmental Slack channel… Nice compact system shaping up for the next 24-48 hours. Normally this would not get my attention but we have been so starved for snow and real winter weather this year I’ll take anything. 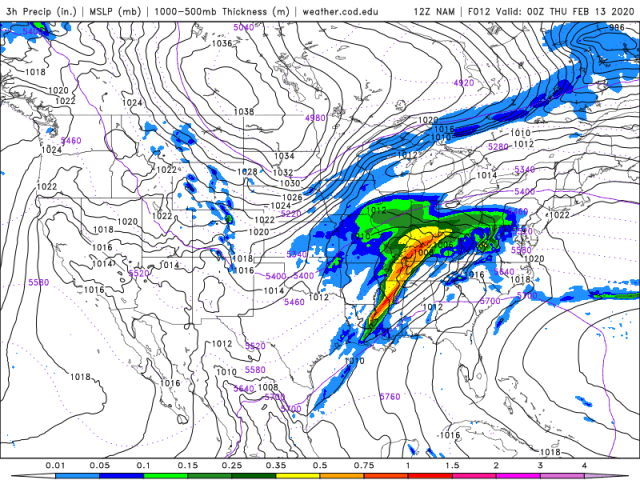 Very interesting MSLP as shown in Figure 1 from the NAM (12Hr FCST). Juicy intense cold front over the Appalachians with copious moisture being fed in (SPC has a SLGHT chance for Severe.. Worried about flooding) Note the solid block high over central Canada and then a second trough squeezed on in over our region. Second figure shows the 500hPa winds.
 VERY VERY broad jet dipping down. Chicago is sitting under, kind of, the left entrance to the NE propagating jet streak. Take a read of this primer on the impact of jets on instability. The left entrance is a region of unstable air and will be enhancing snowfall over our region… Kind of…
Next figure is a forecast sounding taken at the time of maximum snowfall rate, as forecast by NAM, at +12hours, or at around 6pm Chicago time. Green line is the dewpoint or “water content” while red is temperature. Where the red and green lines are close the atmosphere is saturation and clouds can form. Note the temperature axis is skewed (This is called a SkewT Log P chart) so from 1500m to ~4000m the saturated atmosphere is around 10 degrees celsius… This is borderline temperature for nice snow formation (aka the Dendritic growth zone, DGZ). the DGZ is a range of temperatures at which the saturation vapor pressure for air over ice is much less than that for air over water. This allows a process called Wegener–Bergeron–Findeisen where, basically, ice can very effectively suck all the moisture not only from the atmosphere but surrounding drops.. Suffice to say, when you look at a plot like the above and you are looking to forecast snow, look for deep saturated layers at ~-10 to -15c. Also note the steep lapse rate (decrease in temperature with height) from the surface to ~1km… This layer is what we call “Conditionally unstable” which could allow convective clouds to form… This time is right at the change over from mixed precipitation to snow.. So our total accumulation in Chicago will depend on the exact timing.. Expect a NASTY WET SNOW at the peak commute home 🙂

Finally, let’s look at the actual NAM (the 4km “Nest”) forecast above… Hopefully you have gathered from my discussion that model estimates for snow are very uncertain. But if the model (simulation initialized with atmospheric observations) is to be believed we could be shoveling 4 wet inches of snow.. But, wait… There is a kicker here.
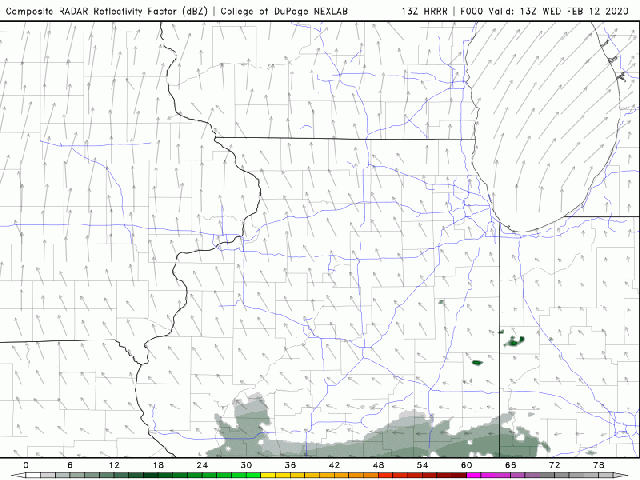
The above animation is from NOAA’s High Resolution Rapid Refresh simulation which is a type of simulation (Model) that we call “Convection permitting”. This means it is high enough resolution to resolve smaller storm systems. But, as it is costly to run it only simulates 18 hours in the future. Note the interesting small features at the end of the predicted radar image. This is a small mesoscale (~100km in size) snow squall.. Behind the squall the winds are turning north east, or off the lake and on to the western shore of lake Michigan. This means we may see some lake enhancement at the end of the event. My take is that we could see 4-7 inches from this event depending on 1) How long we get rain before the snow and 2) If we get some lake enhancement at the end…
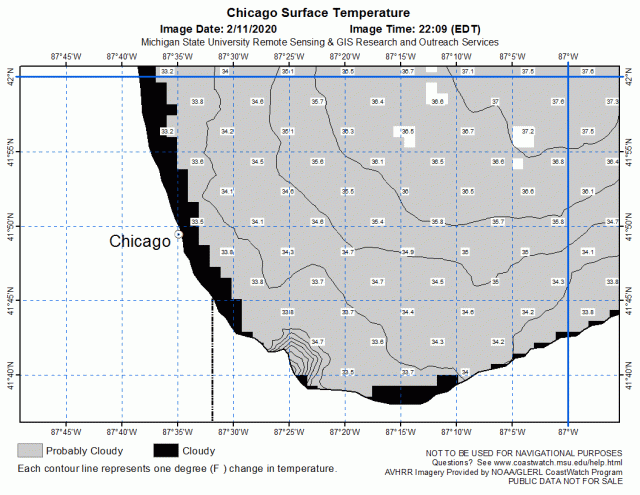
The final image is from Michigan State University and NOAA and shows lake temperatures near Chicago. Just above freezing… So there may be a sweet spot for snow accumulations ~5km inland from the lake edge… it will be touch and go in the city to begin with.
Weather plots courtesy of the amazing COD NEXLAB site!
