

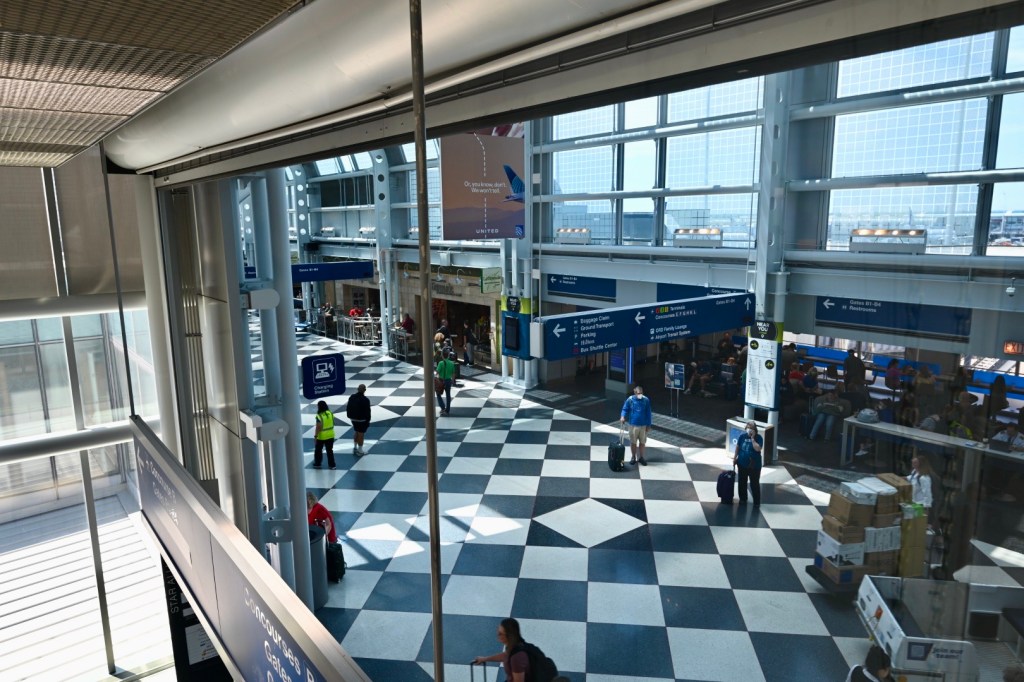
Greetings from O’Hare international Airport. Just dropped my bag off and I am now relaxing in the United Club (yep, I spring, personally, for access as I am an anxious traveler). Flying down to Houston, Texas for a 7 day tour as Mission Scientist for ARM’s TRACER field campaign. It is super fitting I fly to Houston on June 19th as the Juneteenth holiday marks the day that the emancipation proclamation finally made it to Galveston Texas (just outside of Houston).

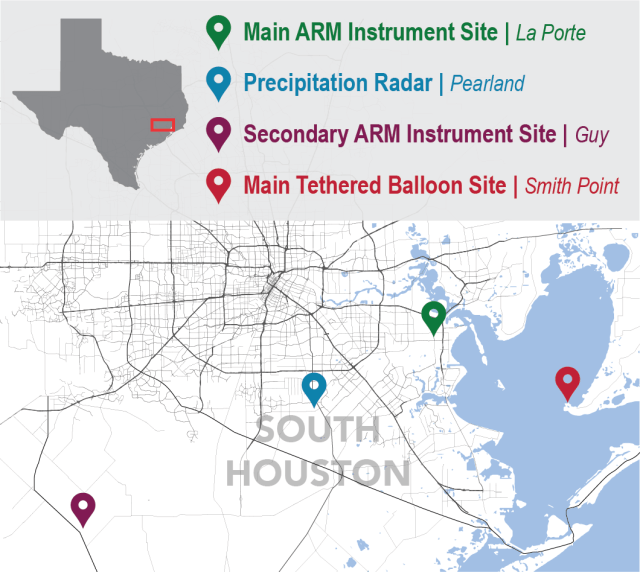
The ARM Facility of the United States Department of Energy is in Houston to study clouds. Specifically clouds that grow big enough to make rain and even become thunderstorms. The fundamental science we are seeking to address is “Are clouds that form when there are more tiny (less than 10 millionth’s of a meter in diameter) particles different to clouds that form when there are less of these particles?” We call these particles Aerosols. They are so small that the force of gravity is small compared to winds and other forces so the essentially float in the air.

We are going to Houston specifically because, according to a paper by Ann Fridlind (and myself and colleagues) Houston is usually a cloud factory this time of year. And some clouds hit air with more of these aerosols and some hit air with less. So we can use our state of the art instruments to see if the drops, snowflakes and winds in these clouds change. This is super important as we have lines of computer code in our weather and climate models that contains our current knowledge of the physics of how clouds interact with these aerosols. And we know we need to know more so we can better predict the weather and climate. And, for the Department of Energy, predicting what the impact of our energy choices have on climate is part of the mission. In addition DOE and partners use weather models to predict wind, solar and hydroelectric power. And, yes those tiny little particles have an outsized impact!


Five (or so) years ago I found out a group was interested in studying thunderstorms and aerosols in Houston. I had been involved in a similar study in Queensland, Australia, so we (myself and my colleague, Robert Jackson) started collaborating and became Co-Investigators on TRACER. Now I am a mission scientist and one of the leads of the forecasting effort! Now my flight is about of board so I have to wrap up! Excited to get to Houston and see those clouds we are studying!


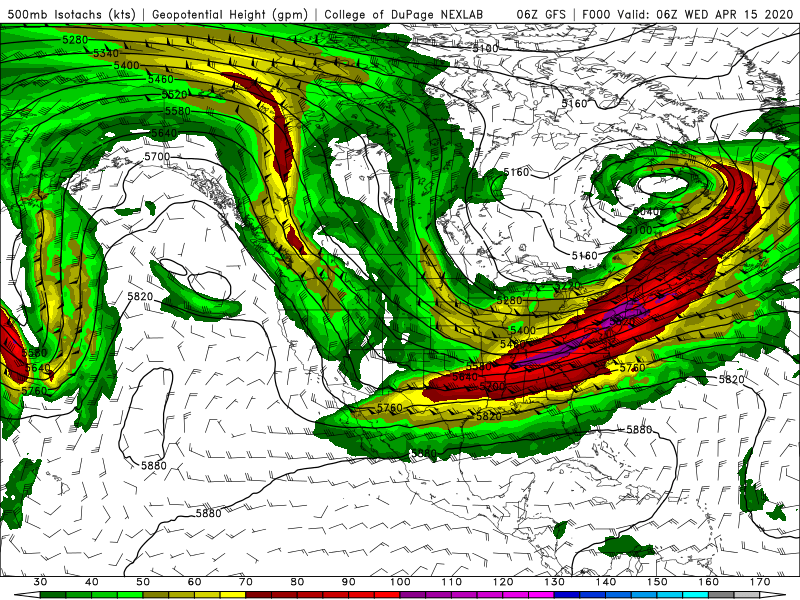
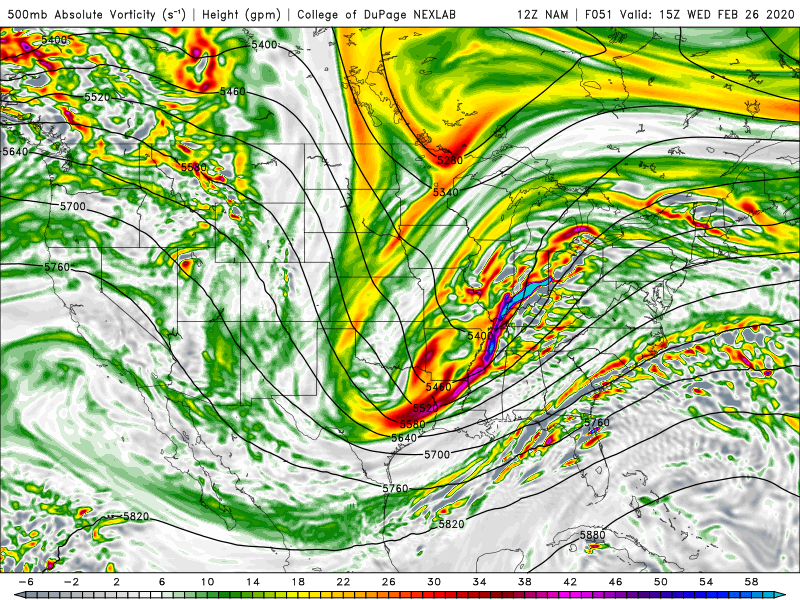
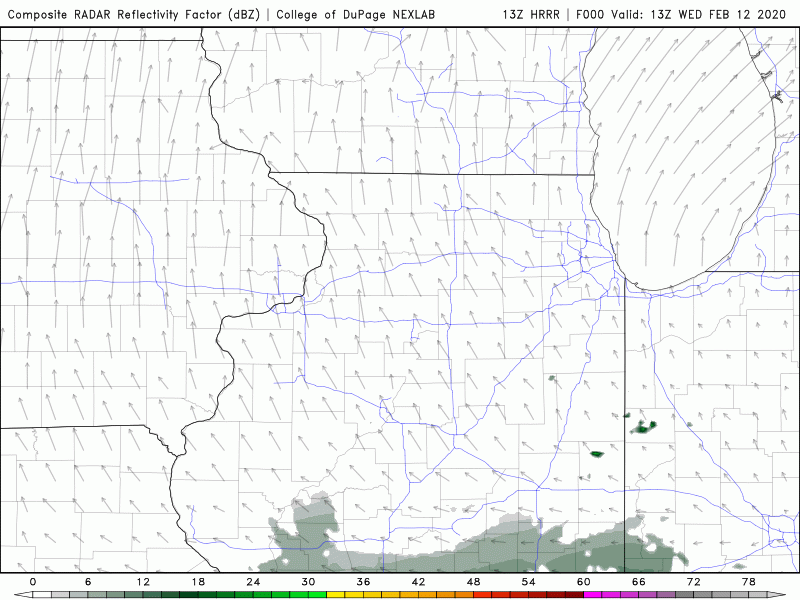
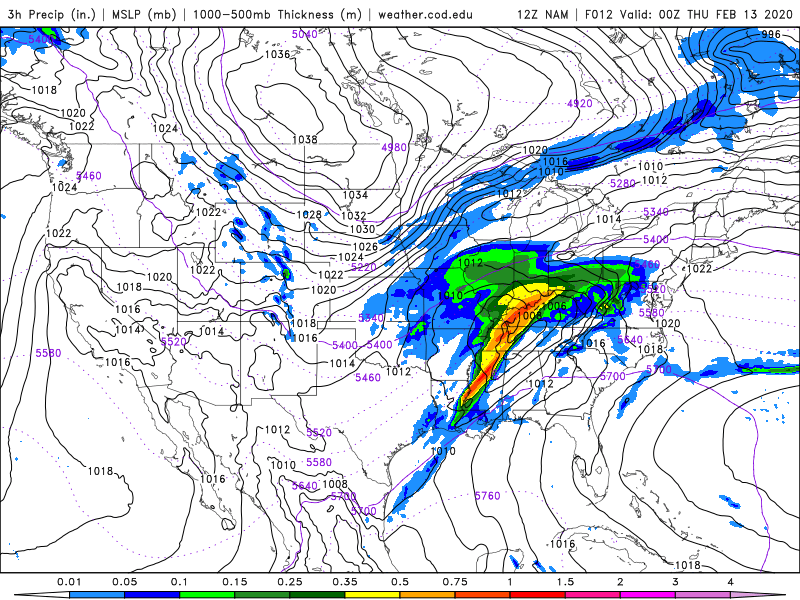 Very interesting MSLP as shown in Figure 1 from the NAM (12Hr FCST). Juicy intense cold front over the Appalachians with copious moisture being fed in (SPC has a SLGHT chance for Severe.. Worried about flooding) Note the solid block high over central Canada and then a second trough squeezed on in over our region. Second figure shows the 500hPa winds.
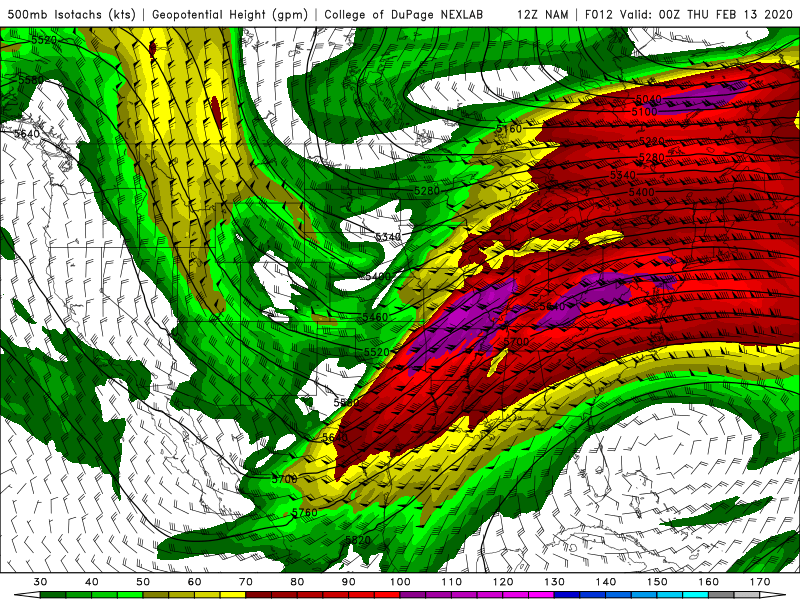 VERY VERY broad jet dipping down. Chicago is sitting under, kind of, the left entrance to the NE propagating jet streak.
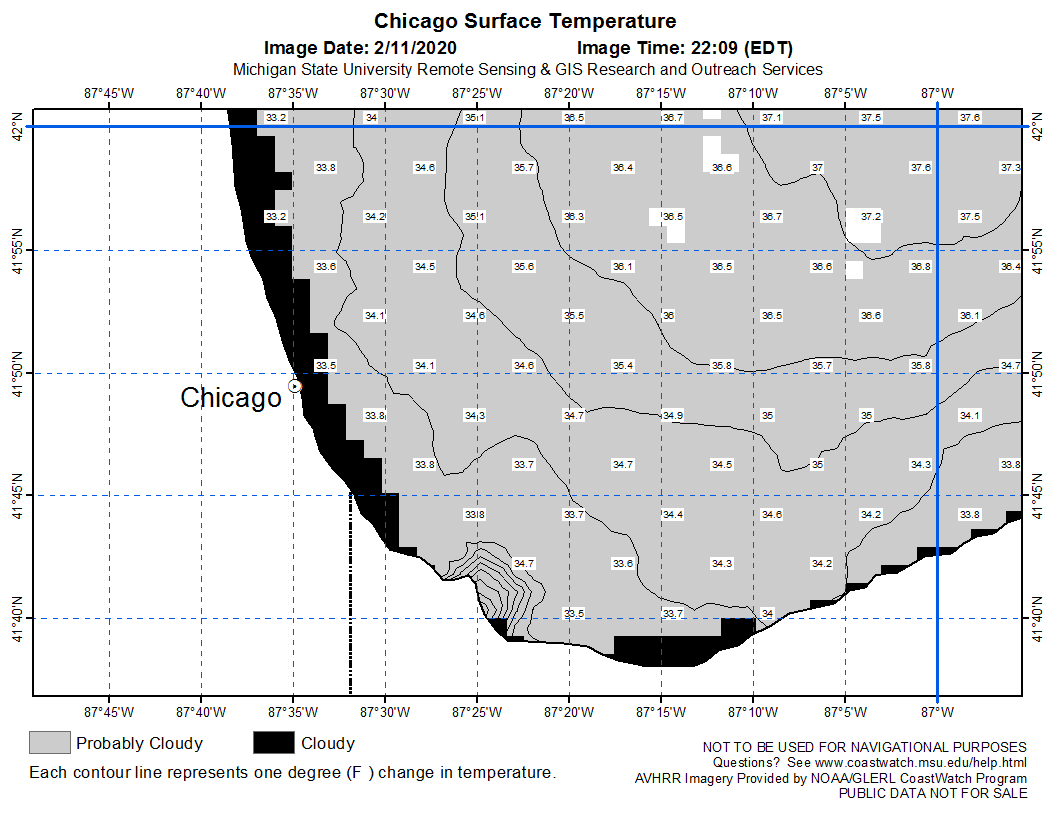

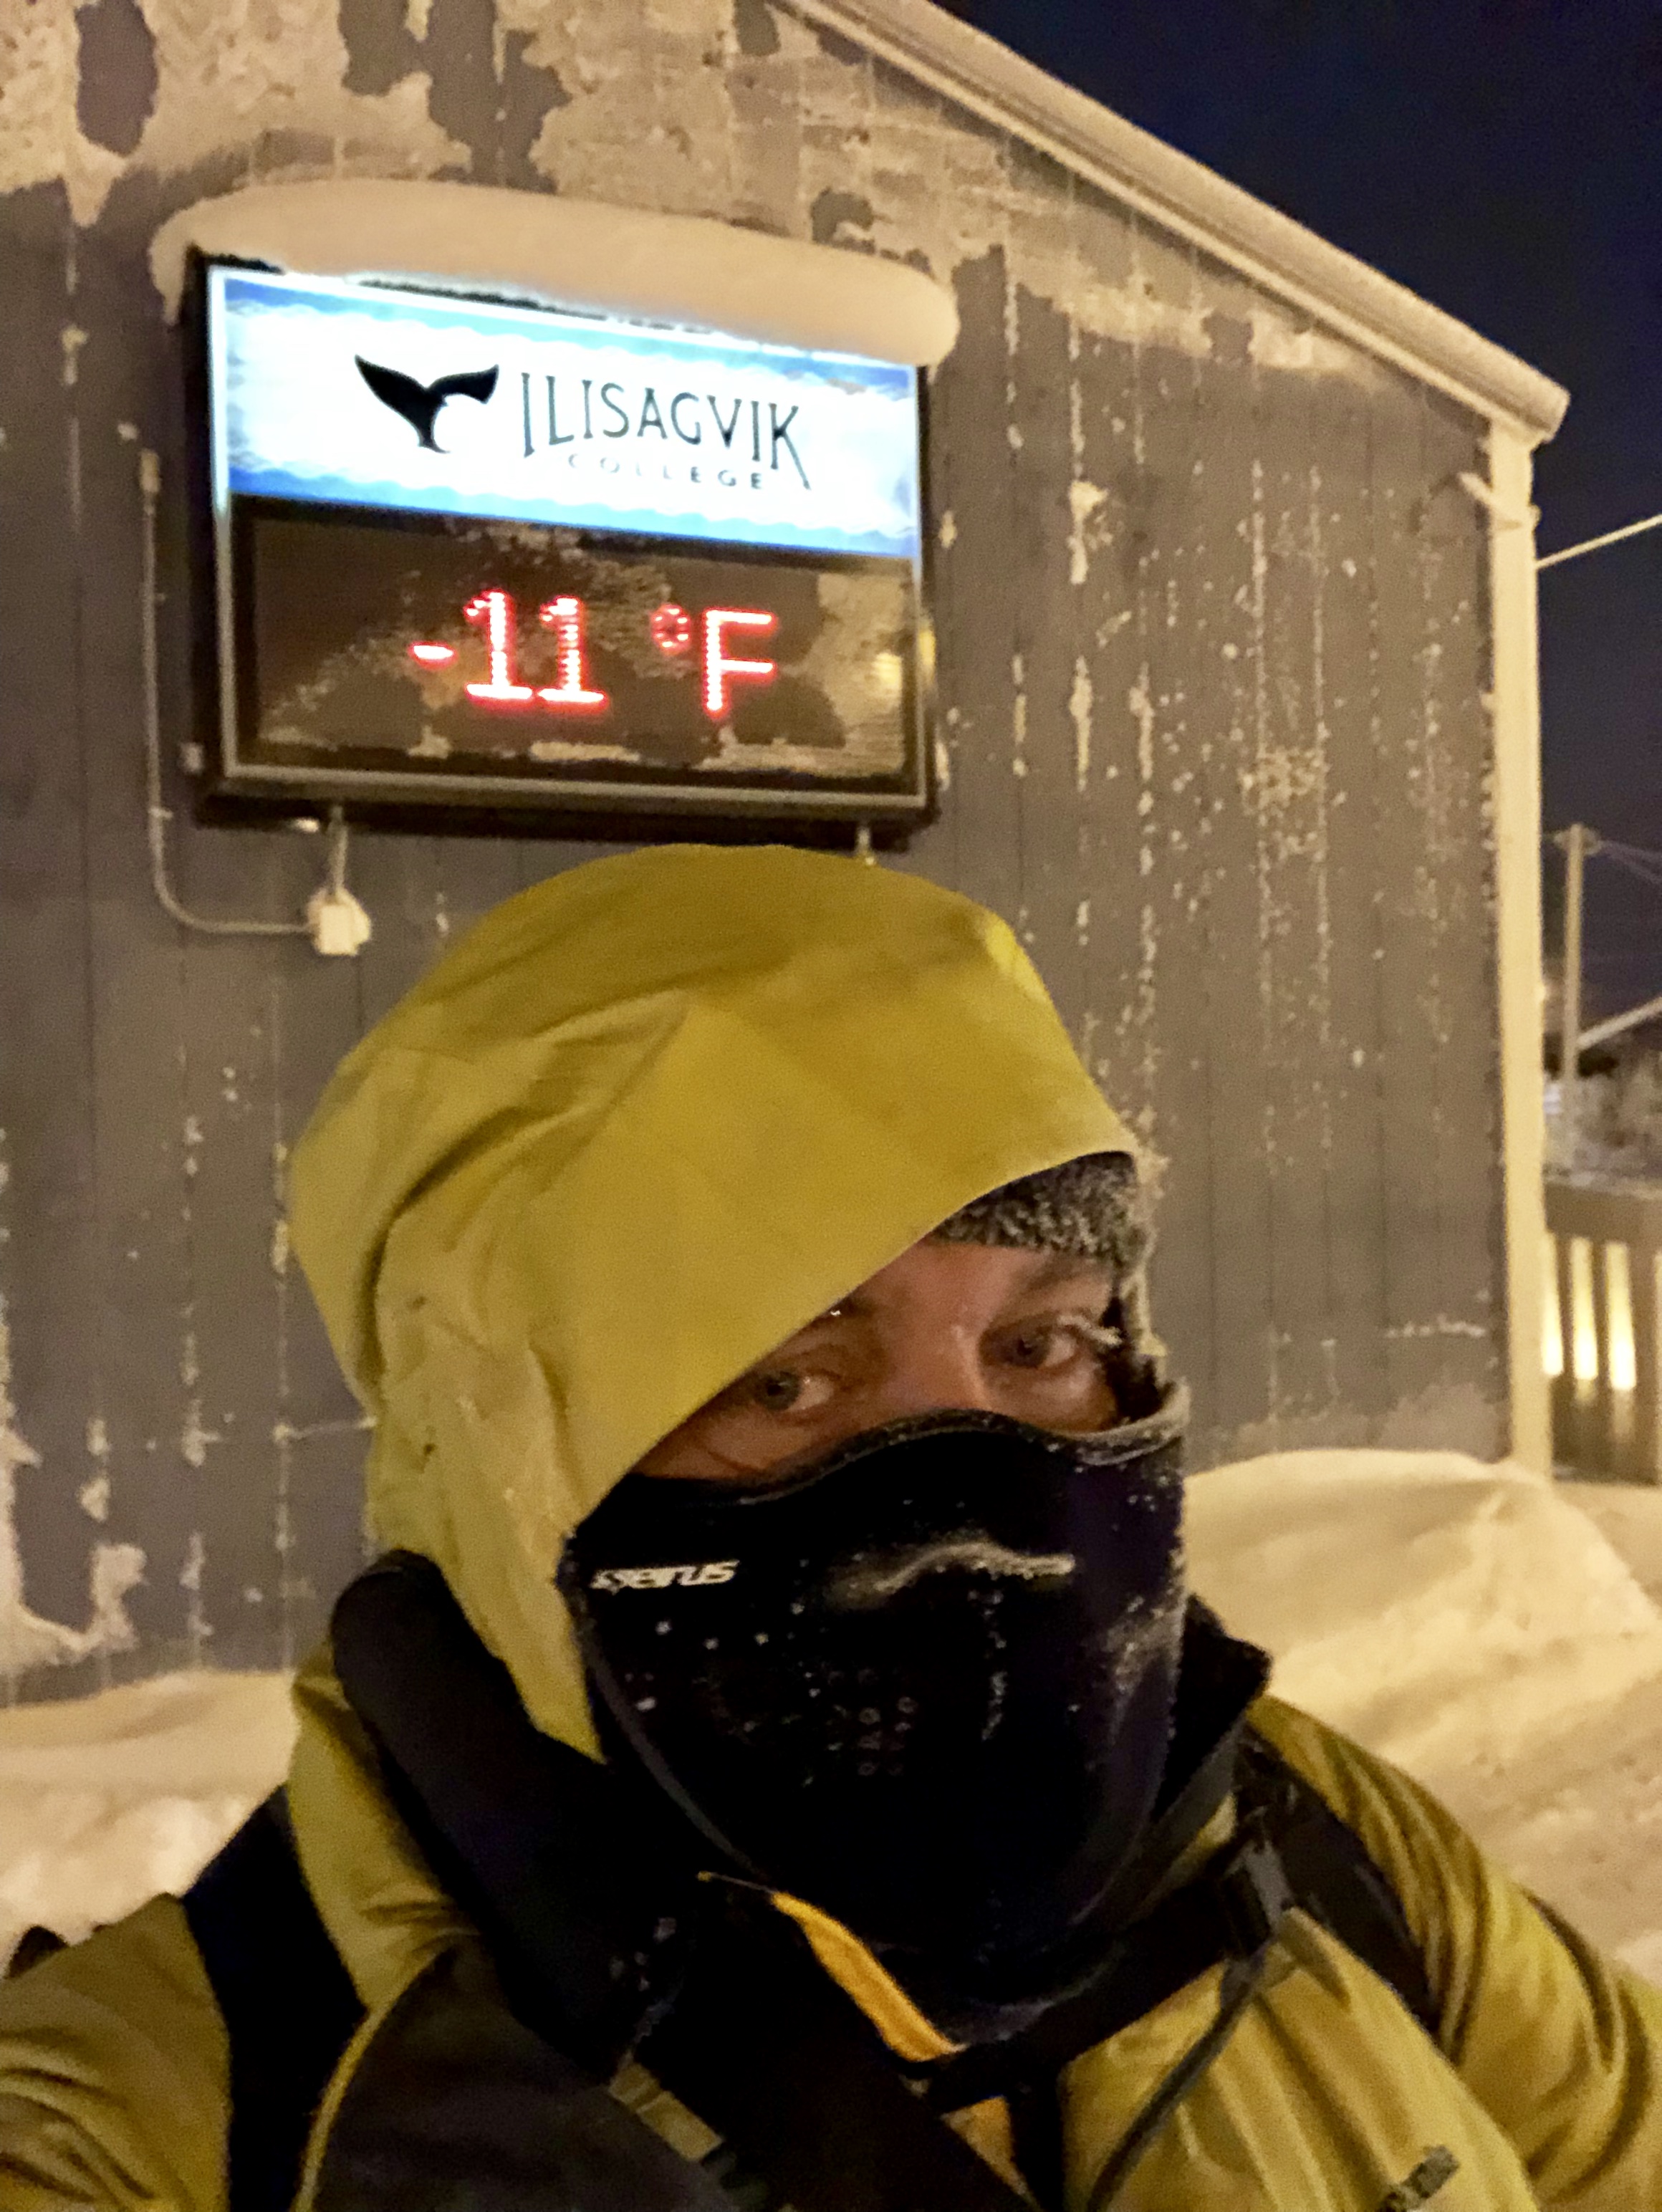
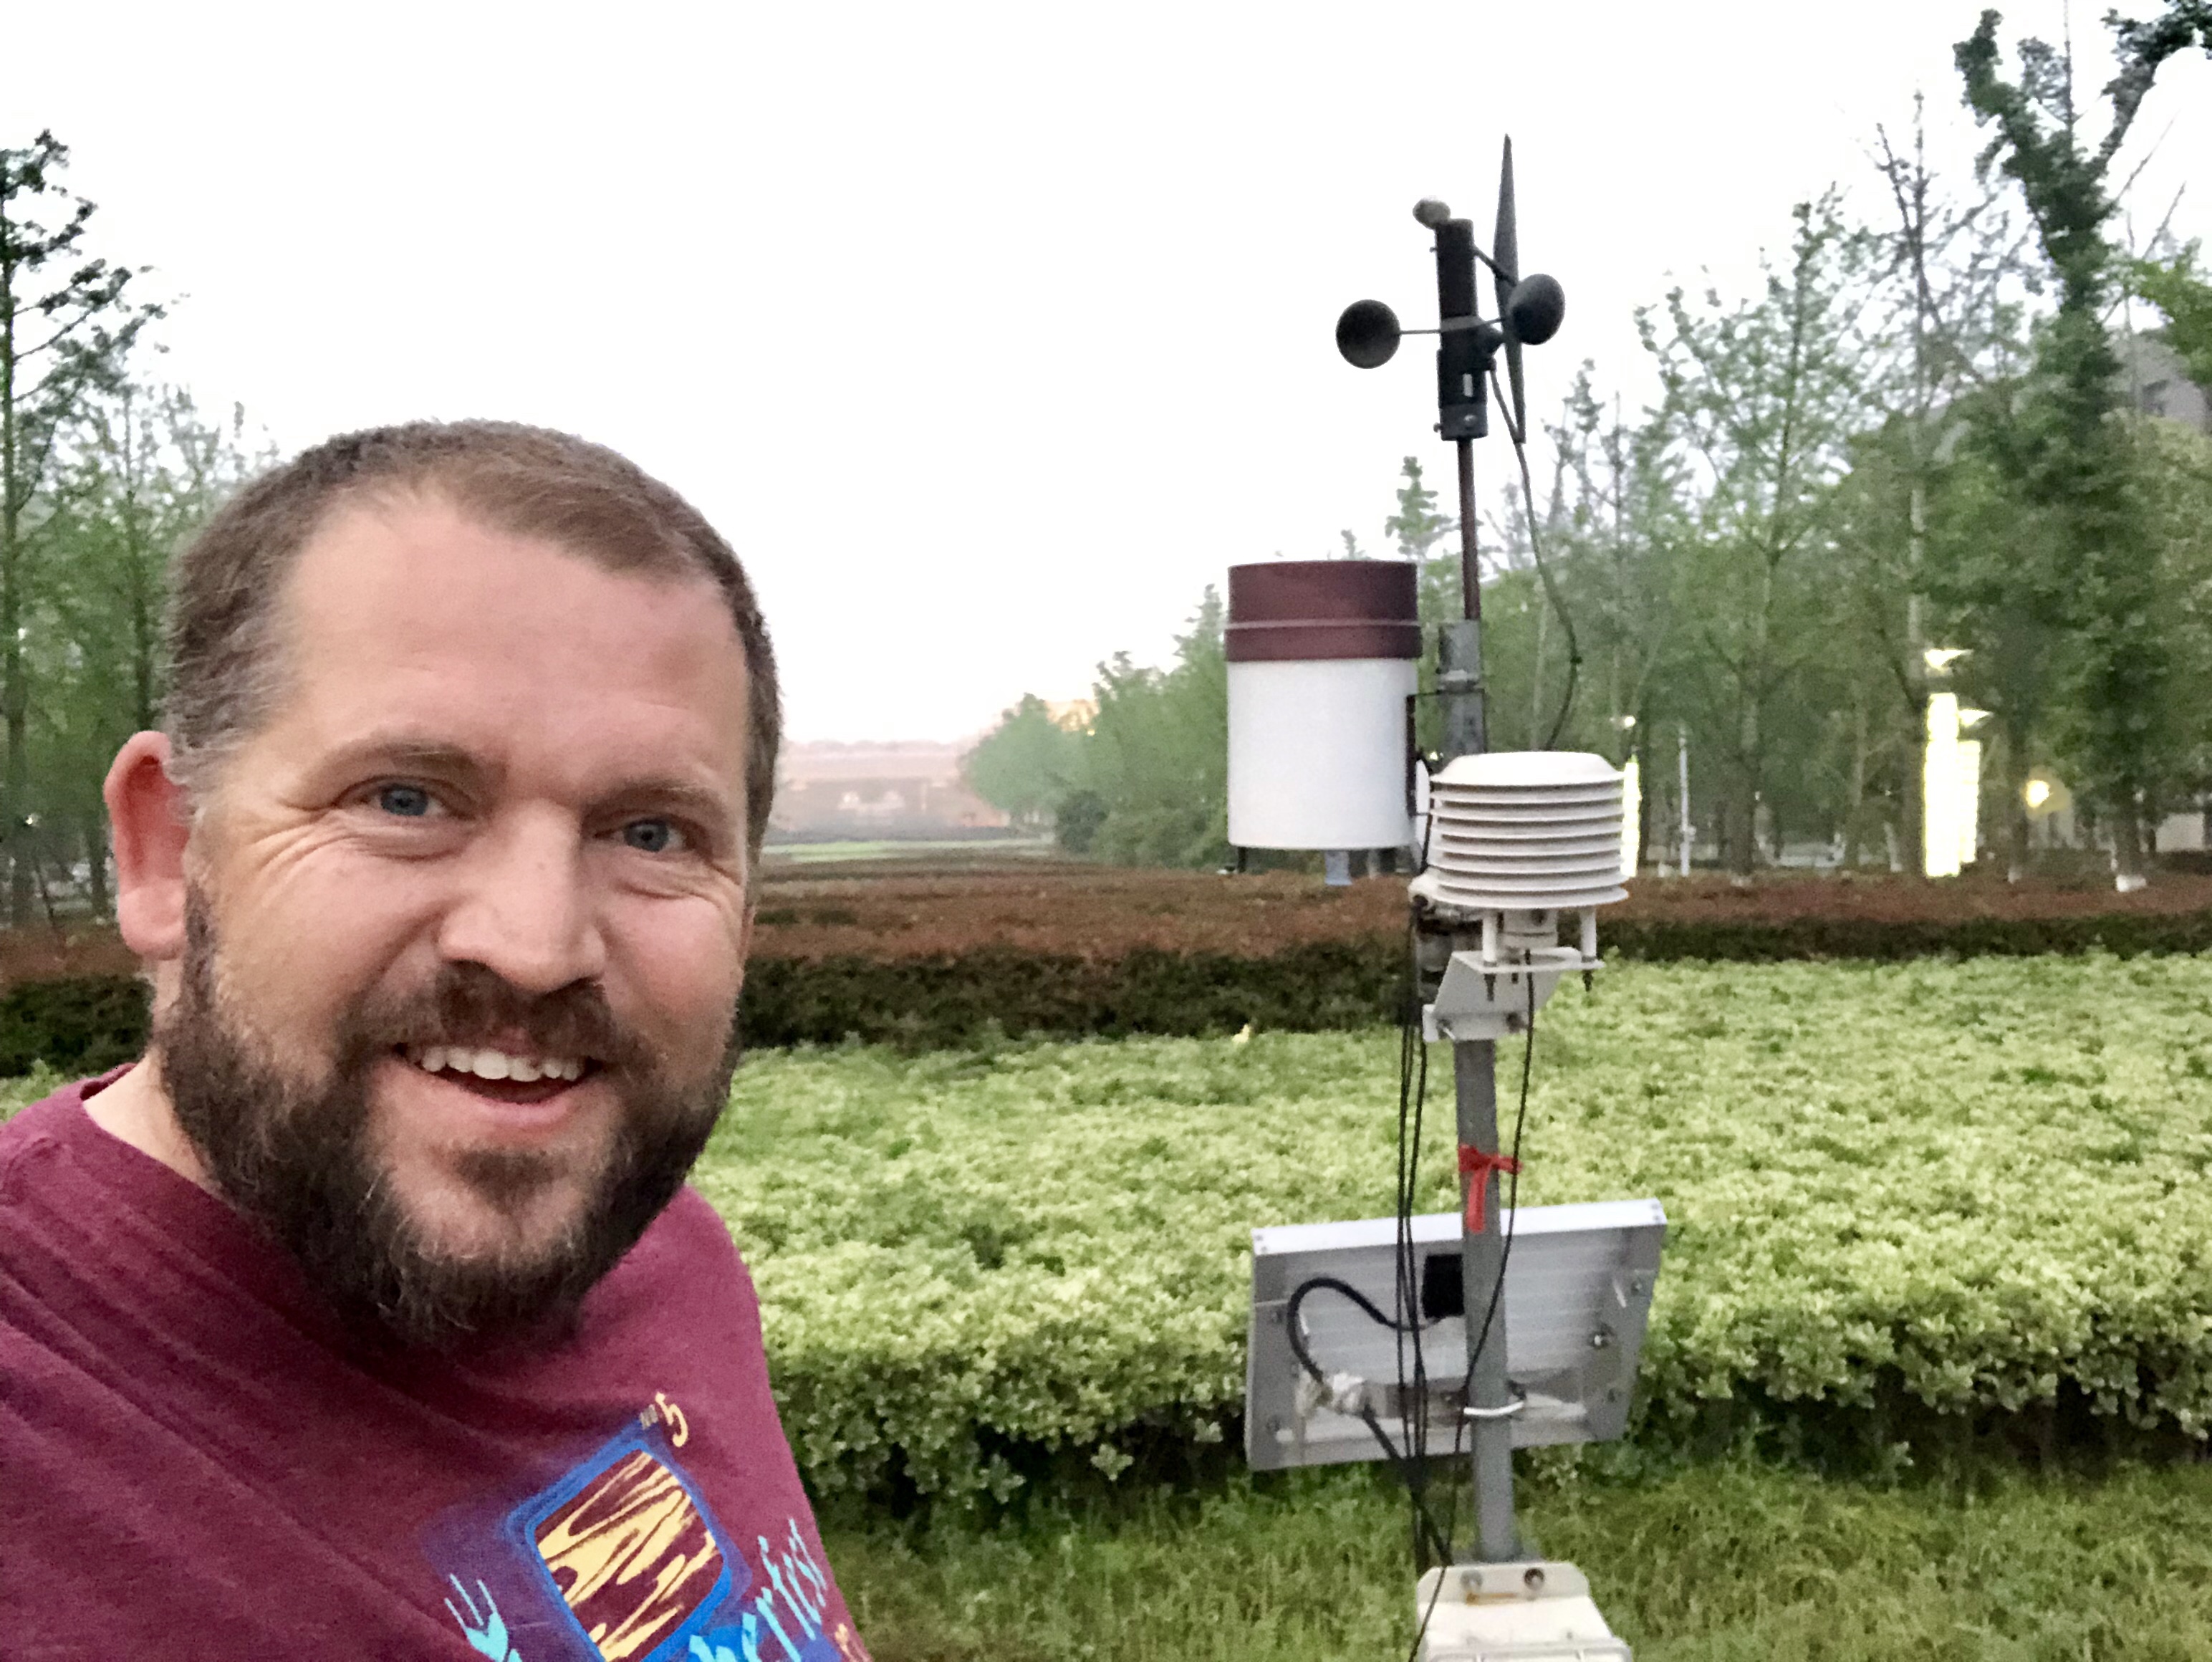 Today I went for a run in Nanjing, China with a (5am) temperature of 70F and a dewpoint of 65F. In China each kg (roughly a cubic meter has 13.37 grams of water in the form of vapor. In Utqiagvik it was a mere 0.35g. From the dry to the dripping wet!