As well stated by my friend Rajesh Sankaran “While I have you here, what is up with the weather? Why is it behaving like an angry confused teenager going through puberty here in Chicago/Midwest? This hot and cold is not fun.”. First, it’s not due to COVID19. Yes, as I said on WTTW Chicago Tonight, there are clear impacts on the atmosphere and our ability to predict it however, the variability that saw us go from shorts weather to snow is a normal seasonal phenomena. In previous posts I have compared the
To this! Charlie does not approve!
upper level winds to “railway tracks” these winds are referred to at the Jet streams or jet stream pattern. At the moment these patterns are very buckled sending storm systems bearing tornadoes and hail into Alabama and southern states while pulling arctic air down over Chicago. If this were mid winter it would be a Chibera, however because things have been warming we are seeing snow and just above freezing at the surface… What is crazy about these snow systems is we are seeing snow at up to +5 degrees celsius! This is because the temperature is cooling so rapidly with height that snowflakes are not melting on their trip from the freezing level to the surface… Silver lining? well hopefully the snow is good for stay at home orders and social distancing.. meanwhile I am getting back into baking to make the house warm…
Current Jet Stream pattern that helps direct the movement of weather patterns…
Back in Australia we had this great place in Canberra called the Dickson Noodle House.. It was a noodle house, in Dickson, about as unpretentious as you can get.. Well I loved two things from there… Laksa and the Char Kway Teow.. I have been trying to perfect my home cooking of both since moving here to the USA.. here is my VERY ROUGH recipe for Char Kway Teow. For those in the western burbs you can get most ingredients at Wholegrain market.
Shopping list:
Bunch of kale, shredded
Garlic
sesame oil
BBQ pork Char Siu, sliced
~1lb chicken thighs chopped (sorry, don’t substitute breast.. needs to be the naughty cut)
dark soy sauce
fish sauce
sugar
flat fresh rice noodles cut into ~1cm wide strips
your favourite hot sauce
two eggs
Cooking:
First, lay all ingredients out.. This will be action cooking. Prepare the sauce by mixing ~2 tablespoons of soy sauce, 2 tsp of fish sauce, 2 tsp of sugar and ~1tsp of dark soy sauce.
The rest of the cooking will be done in two batches in a HOT wok.. Heat the wok with oil in it.. Add 1/2 the garlic crushed, 1/2 the chicken and 1/2 the pork.. Once the chicken browns add 1/2 the noodles and stir fry until the noodles begin to brown a little. Move mix to one side of the wok and add an egg.. scramble the egg, thow in 1/2 the kale and a tsp of the hot sauce.. Continue to stir fry everything together! Once the kale is good and wilty/cooked splash in 1/2 the sauce mix and stir thoroughly. Transfer to a large bowl and repeat for the second batch… Once that batch is cooked add the first batch back to the wok and heat.
A few tips: First thing to hit the oil should be the garlic.. Keep it hot! there will be some charring but when you do the second batch this gets “absorbed” into the mix.. Do not cook for long once you add the sauce.. you do not want to reduce the sauce or the meal will become very salty..
Perhaps later I will add pictures 🙂 And here is hoping I did not forget anything 🙂 Happy quarantine-eating!
Out of a possible 12 inches in my neck of the we saw about 2.5. And the pavement was so warm I didn’t even need to clear…
My thoughts were captured by WBBM Reporter Bernie Tafoya:
cott Collis is an atmospheric scientist at Argonne National Laboratory and leads the Geo-spatial Computing, Innovations and Sensing Department.
He said Tuesday a lot of information was fed into weather simulations from Sunday’s 55-degree temperatures to the oncoming sub-freezing temperatures. The way the air was moving in the atmosphere made it a real “challenge” to forecasters, especially because the weather system was relatively small, only a couple of hundred miles wide.
Collis said the axis of unstable air actually moved farther to the south.
This winter has been a rollercoaster! I was riding outside yesterday with temperatures in double digit celsius (55F). Well this was the peak of the ride and now we are about to come crashing down. Whenever you have unseasonal warmth there has to be a gradient in temperature somewhere and nature likes to destroy those gradients with nice juicy weather systems. The story for this system is all in the middle of the atmosphere.
The above figure shows the vorticity of the winds. Or how much they are spinning. There is a whole heap of math I could lay on you but simply put vorticity helps air go up. And rising air (also called unstable air) allows clouds to form as it cools as it rises becoming saturated. So the other thing we need is moisture.
The figure above shows temperature (red) and dewpoint (green, a measure of moisture content) throughout the atmosphere and is referred to as a Skew T Log P diagram. To the right of the temperature trace you can see the wind barbs. The direction is from the “flags” to the tip. In this case we can see winds from the North East up to about 3km. These are coming right off the lake! The lake is running very ice free at the moment so those cold winds will be fully saturated as they move over the water. And with the aforementioned vorticity forcing the air to rise we should see very effective “wringing out” of the air like a sponge! Now, there is one more ingredient. To get real good snow you need there to be plentiful saturated air in the dendritic growth zone (see previous post).
A second forecast sounding (from the “North American Model, NAM“) , shown above, is truly remarkable. For one the vorticity is forcing ascent so effectively you have a rapid cooling of temperatures with height. This is very unstable air. Second, you have a deep slab (~3km) of saturated air between -10c and -15c. If this verifies this will be a snow making machine!
The only real part spoiler will be if the models (simulations) are being initialized with bad data. This is entirely possible (and I think the NWS in Chicago are thinking this given their forecast) and the surface layer of air is way warmer that the model analyses (simulation time step zero). Prediction: If it pans out the way the NAM/GFS are predicting we will see rain turn to light snow Tuesday morning around 4am. Snow will remain light as the vorticity maximum remains to our west until around 3pm when snow will begin to intensify (if it is not rain). Overnight the party really starts with the most intense snowfall rates right in time for Wednesday morning’s commute. Again, big uncertainty is rain versus snow. My bet is for that cold air to replace the warmer airmass we have over us pretty quickly. Despite the warm weather our closest soil temperature measurement in St Charles shows 4in temps of 33F. So we will not see much heat coming from the soil into the air. The Chicago region could see from 8 to 14 inches for this event. However this is a complex system and small errors in the location of that high vorticity air could have a big impact. FUN TIMES!
This is basically a dump from our Departmental Slack channel… Nice compact system shaping up for the next 24-48 hours. Normally this would not get my attention but we have been so starved for snow and real winter weather this year I’ll take anything. Very interesting MSLP as shown in Figure 1 from the NAM (12Hr FCST). Juicy intense cold front over the Appalachians with copious moisture being fed in (SPC has a SLGHT chance for Severe.. Worried about flooding) Note the solid block high over central Canada and then a second trough squeezed on in over our region. Second figure shows the 500hPa winds. VERY VERY broad jet dipping down. Chicago is sitting under, kind of, the left entrance to the NE propagating jet streak. Take a read of this primer on the impact of jets on instability. The left entrance is a region of unstable air and will be enhancing snowfall over our region… Kind of…
Next figure is a forecast sounding taken at the time of maximum snowfall rate, as forecast by NAM, at +12hours, or at around 6pm Chicago time. Green line is the dewpoint or “water content” while red is temperature. Where the red and green lines are close the atmosphere is saturation and clouds can form. Note the temperature axis is skewed (This is called a SkewT Log P chart) so from 1500m to ~4000m the saturated atmosphere is around 10 degrees celsius… This is borderline temperature for nice snow formation (aka the Dendritic growth zone, DGZ). the DGZ is a range of temperatures at which the saturation vapor pressure for air over ice is much less than that for air over water. This allows a process called Wegener–Bergeron–Findeisen where, basically, ice can very effectively suck all the moisture not only from the atmosphere but surrounding drops.. Suffice to say, when you look at a plot like the above and you are looking to forecast snow, look for deep saturated layers at ~-10 to -15c. Also note the steep lapse rate (decrease in temperature with height) from the surface to ~1km… This layer is what we call “Conditionally unstable” which could allow convective clouds to form… This time is right at the change over from mixed precipitation to snow.. So our total accumulation in Chicago will depend on the exact timing.. Expect a NASTY WET SNOW at the peak commute home 🙂
Finally, let’s look at the actual NAM (the 4km “Nest”) forecast above… Hopefully you have gathered from my discussion that model estimates for snow are very uncertain.But if the model (simulation initialized with atmospheric observations) is to be believed we could be shoveling 4 wet inches of snow.. But, wait… There is a kicker here.
The above animation is from NOAA’s High Resolution Rapid Refresh simulation which is a type of simulation (Model) that we call “Convection permitting”. This means it is high enough resolution to resolve smaller storm systems. But, as it is costly to run it only simulates 18 hours in the future. Note the interesting small features at the end of the predicted radar image. This is a small mesoscale (~100km in size) snow squall.. Behind the squall the winds are turning north east, or off the lake and on to the western shore of lake Michigan. This means we may see some lake enhancement at the end of the event. My take is that we could see 4-7 inches from this event depending on 1) How long we get rain before the snow and 2) If we get some lake enhancement at the end…
The final image is from Michigan State University and NOAA and shows lake temperatures near Chicago. Just above freezing… So there may be a sweet spot for snow accumulations ~5km inland from the lake edge… it will be touch and go in the city to begin with.
Whenever I have the best things to share I am at my busiest.. And I don’t post.. Life has been good and busy. Some very exciting things are happening like NSF giving us 9M for Sage. And a chance I can get into active storm tracking (it’s so cool when you hear folks are as excited about a subject as you..). More updates coming soon.. Open source, radar, science, cycling and.. A SKI TRIP TO WHISTLER! Bring it.
Let’s start with two key messages, one, I am not a medical doctor and everything in this post is for entertainment value only, two, and with that said, if you ever experience chest pains err on the side of seeking higher medical care. My diagnosis (talked about later) was only possible using equipment available at a well equipped facility like a hospital. With 20/20 hindsight I would have gone to the ER sooner.
Not Happy, getting oxygenated in the ER
Rewind around three weeks and you find me preparing for the AMS Radar conference in Japan as well as giving an interview at WTTW on Hurricane Dorian (I am now somewhat of a regular on the show, we have a great relationship where I am using my skills as “chief weather explainer”). The day after my appearance I developed what can only be described as “body soreness”. I had felt this before and, after some difficulty breathing had developed, back in February, I was diagnosed with Pleurisy likely stemming from a lung infection (a diagnosis, it would turn out, that was false). My first mistake was not going to the ER when the chest discomfort first started, opting instead to seek my insurers permission to go to an out of network urgent care. This would end up being a mistake on so many levels, but it was my Australian side which made me want to seek a less extreme solution first as not to burden the system. With a diagnosis (false) of GERD and possible gallstones (very false) I headed home to heal up in time for my travel to Japan with antacids and antibiotics.
Designing a course in open radar science from a hospital bed….
Now, let me continue by laying out some truths: We all do things for a reason. What is sometimes perceived by others to be irrational can be completely rational and justifiable to the individual carrying out the action. In my case the upcoming trip to Japan had a very high cost of cancellation. The trip had high professional and personal value. Professional as I was establishing our open science agenda on a whole new continent, personal as Louise, who has deep connections to Japan, was accompanying me, my first time mixing a work trip with personal time in my 10 years at Argonne.
So it was with great distress, with 8 days to go before our travel begun, I headed to the Emergency Room at Hinsdale Hospital due to unbearable pain (referred to my left shoulder, a symptom that screamed heart issues). Now is a good time to re-read the statements at the start of this post!
Remaining active. Very careful walks (monitoring heart rate using my Apple Watch) around the amazing Nara shrines kept me sane, and along with Alcohol avoidance, even led to some good weight loss on travel. Huge thanks to Louise for putting up with my snail like pace.
On admission to the ER the ruling out of conditions began. EGC normal, CAT scan shows no sign of lung related blood clots (scary! Symptoms include sudden death). No fluid build up around the ankles (sign of congestive heart failure). Chest X-ray did show some signs of fluid on the lungs and, a key symptom, my Blood O2 was hovering around 84% saturation leading them to put me on Oxygen. I was admitted to the Hospital with suspected pneumonia. Here is where the hospital care system kicked in and was very good. You got assigned a primary care physician who can then call on experts. My primary care physician assigned a Pulmonologist and a Cardiologist. This is where my try journey to a diagnosis began as I started an set of comprehensive tests. BNP test came up negative, lowering the chance of congestive heart failure, ultrasound showed normal flow but showed some minor build up of fluid around the heart leading to a diagnosis (that Louise had theorized doing some Google-MD-ing) of Pericarditis. Pericarditis is a nasty little affliction caused by inflammation of the surrounding tissue and fluid of the heart. It is actually correlated with increased exercise! A final test, a brutal two hour heart MRI, saw me discharged after a two night hospital stay with some very powerful anti-inflammatories. And four days later I deemed my health good enough to travel (see early statement on rationality). What followed was a successful but very carefully executed trip to Japan where I took very keen care of my health. Over time the good days have become more frequent than the bad days but the condition has lingered and I am heading to the Cardiologists office this afternoon.. When you read the literature about Pericarditis you can read a lot about “What” but precious little about “Why?” or “What the hell do I do to stop this debilitating thing happening?”…
August starts a health kick. I managed to loose over 40 pounds in April/May in a lead up to the Barry Roubaix 2019. Unfortunately I put 15 of those pounds back on as I transitioned to a new management role and also got very busy with proposal development. Louise and I made a blank chart for tracking weight and I started using the two techniques I know work for me for weight loss: T
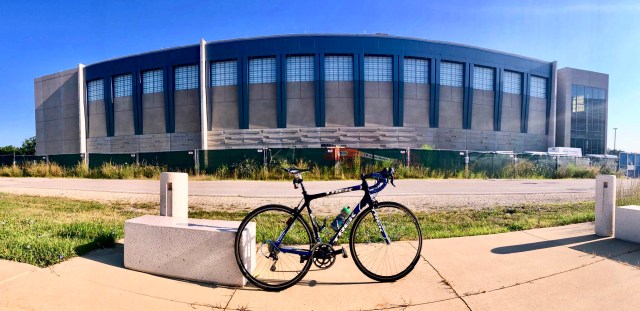
Leaning in front of the future home of Aurora 21 the Exascale computer.
racking calories (religiously) and cycling. Luckily the start of August saw a change in the weather in Chicago, gone were the rains here were low humidity sunny days.. When I
Rolling into the weekend.
first moved to the are I bike commuted every day of every week. I have fallen out of this habit which is good for me and good for the planet. So the week of the 5th I committed myself to doing the commute (8 miles each way) every day even if I started to get tired and sore.
I think the main difference between then and now (besides being older) is I ride a lot harder.. I started riding on a Kona Dew commuter set up with panniers and a simple garmin now I ride a Trek Madone, carry the bare essentials for work and have a top of the line power meter (well it was.. the Vectors are showing their age)… A sunny week of great weather made riding the 143km
Pristine conditions at Palos. Demoing the bike I ended up buying
very pleasant.. And to top it off I finally decided on my new mountain bike purchase (more on that
later) leading to 25km of fun times at Palos on the weekend.. So 168km or 104 miles.. Nice consistent miles. How do I feel, well I have already lost (back) 5lb despite enjoying a few craft beers on the weekend. Fatigue is really kicking in but I am finding by moderating my commuting efforts (telling myself it is ok to ride at 150W) I can start to actually recover on my commutes.
Most noticable is the drop in my resting heart rate.. Ever since I had my blood pressure medication reduced my resting heart rate has been around 60.. Now I am back down to around 56 overnight. And waking up feeling great… Now to keep it up as I get busy again. The most notable number is, according to Strava, I burnt 5126 Calories the bike.. Now you can go nuts reading websites on how calorie deficit you need to lose a pound but commonly the answer is around 3000-3500 calories.. So, an extra 5126 calories burnt getting me to work has me feeling fine!
WTTW Chicago tonight gave me a yell asking about the record lake levels. I have been watching the evolving large scale forcing behind the recent rains.
Irene and Vidya (SAVEUR Scientists) pouring over a map of Chicago identifying key areas to study in Chicago
It is nice as my work on the NSF funded SAVEUR project (Collaboration between Argonne, Northwestern and the University of IL) gives me a little freedom to do this given our focus on Chicago and the region. In a nutshell: It’s complicated. This time of year we are not particularly strongly impacted by ENSO (Weak but persistent El-Nino) or NAO. But it has rained. A LOT. Chicago beat its all time may record with 8.25 inches (sorry about the old money) of rain.. This is over double its mean rainfall of 3.68 inches. Furthermore the rain has come from a series of torrential persistent (organized) downpours. This has allowed the soil column to becomes so wet it looses the ability to soak, store and evaporate the rain leading to increased run off.
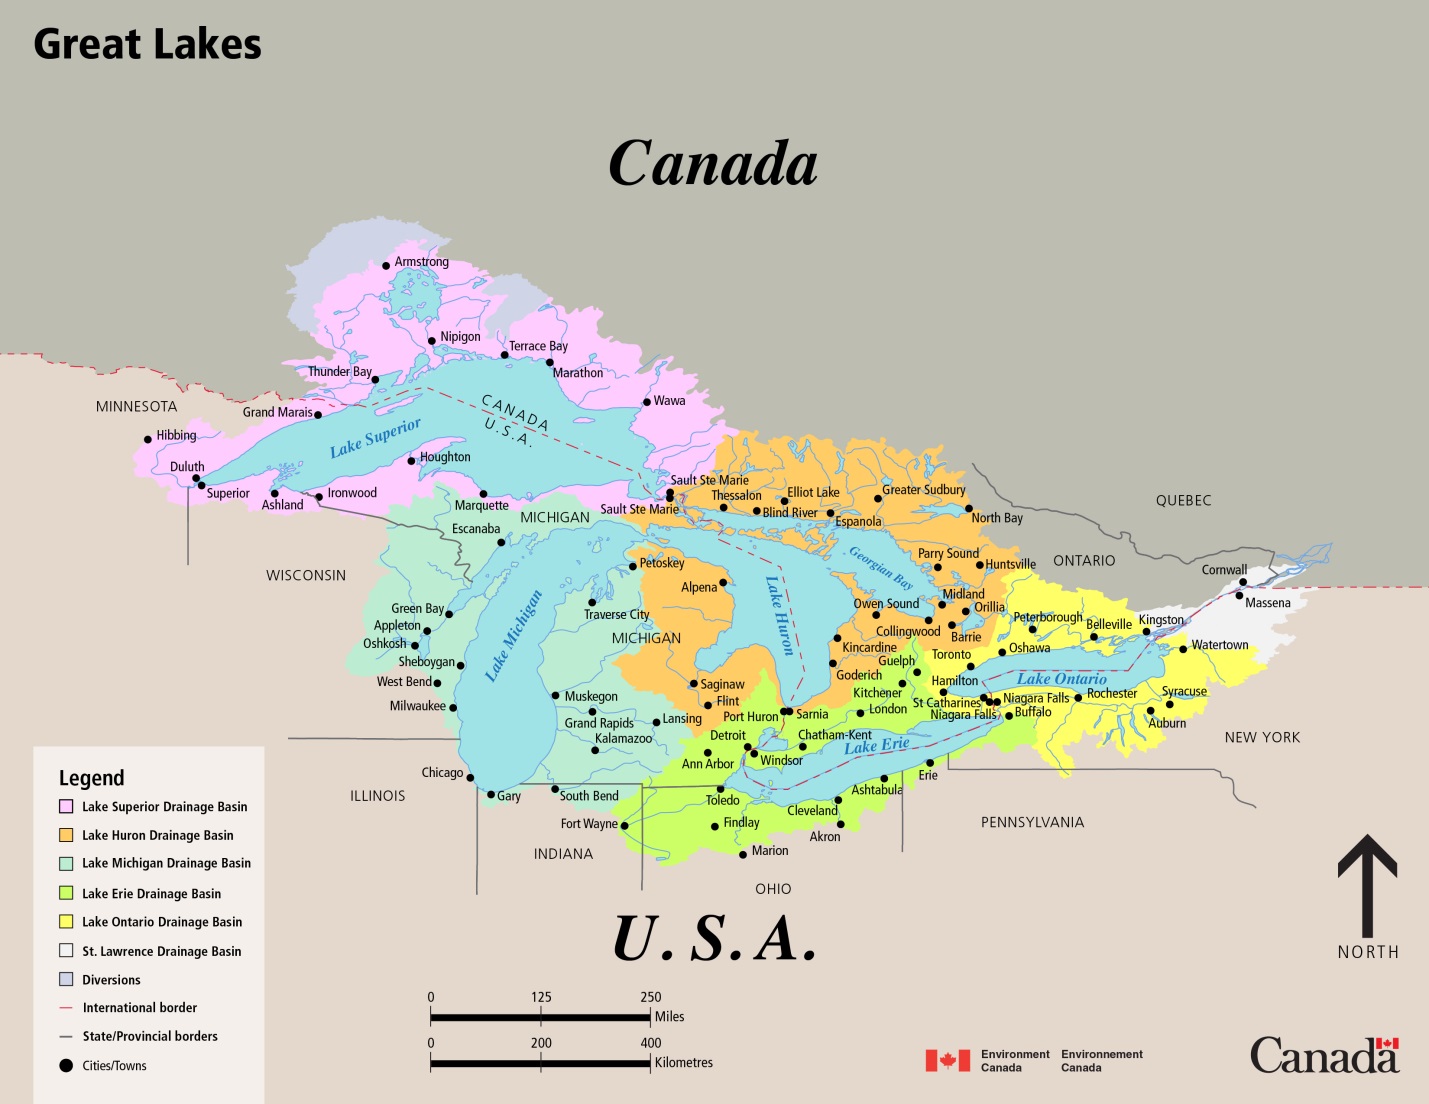
“But wait!” I hear the hydrologists amongst you exclaim, “Only a fraction of the Chicagoland region is in the Great Lakes watershed”. Well you are correct random hydrologist! The figure to the left (from Environment Canada) shows the watersheds of the great lakes. However, take a look at this site from NOAA which shows almost every area around the lakes has received much greater than average rainfall. Furthermore, it has been cold and damp and the lakes themselves have been cold thus inhibiting evaporation. The lake levels (or more so the rate of rise of the lake levels) is the solution to a simple budget equation: The rate of rise (or fall) is water in (Rainfall and diversions from some watersheds in) minus water out (flow into Atlantic via the St Lawrence River plus water lost from diversions away from the lakes plus evaporation). Each of the terms on both sides of this equation involve very complex physics and geopolitics. For example did you know that far less water is diverted away from the lake in Chicago (to the Mississippi) than is added to the lake on the Canadian side? But there is a hard limit to how much extra flow can be added at each point (to the great relief of those living in Montreal). So with well above average rainfall, very wet soils (see this calculation from NOAA with runoff around the lakes at the 95+ percentile) limited evaporation an already modestly full lake system is now breaking records.
What a difference a few months makes. Back in January I was visiting Utqiagvik as a guest of Argonne’s Education and Outreach team. When we arrived it was -20F and lets just assume the dewpoint was -20F. Today I went for a run in Nanjing, China with a (5am) temperature of 70F and a dewpoint of 65F. In China each kg (roughly a cubic meter has 13.37 grams of water in the form of vapor. In Utqiagvik it was a mere 0.35g. From the dry to the dripping wet!


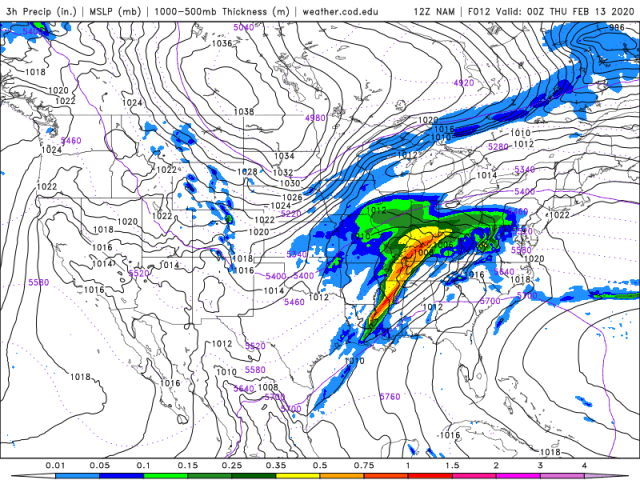 Very interesting MSLP as shown in Figure 1 from the NAM (12Hr FCST). Juicy intense cold front over the Appalachians with copious moisture being fed in (SPC has a SLGHT chance for Severe.. Worried about flooding) Note the solid block high over central Canada and then a second trough squeezed on in over our region. Second figure shows the 500hPa winds.
 VERY VERY broad jet dipping down. Chicago is sitting under, kind of, the left entrance to the NE propagating jet streak.


 Today I went for a run in Nanjing, China with a (5am) temperature of 70F and a dewpoint of 65F. In China each kg (roughly a cubic meter has 13.37 grams of water in the form of vapor. In Utqiagvik it was a mere 0.35g. From the dry to the dripping wet!